


SHREDu: HVC TYPOLOGIES - Trading Education
SHREDu: HVC TYPOLOGIES - Trading Education
This will be a work in progress for a few weeks but I thought I would share it as I go. I will send out notifications as I add to the HVC catalogue. This will become a catalogue of HVC variations.

My bread and butter plays in this market are HVC (high volume close plays). My trade stats show my highest performance when I buy day 2 or day 3 after an HVE (highest volume ever), HV1 (highest volume in one year) or HVIPO (highest volume since IPO) occurs.
An HVE, HV1 or HVIPO day signals something significant has occurred at the given company. The vast majority of TML’s (true market leaders) have printed HVE’s and/or HV1’s in the beginning of their runs.
Couple an HVE, HV1 or HVIPO day with a good DCR (daily closing range) and a cooperative market, and you’re really stacking the favor on your side.
What I want to do in this post is to begin diagramming and cataloging the different variations and typologies of how I play HVC’s.
Believe it or not, there is a big difference on how I initiate positions day 2 versus day 3. Let’s start with day 2 plays.
HVC-D2 (HIGH VOLUME CLOSE - DAY 02):
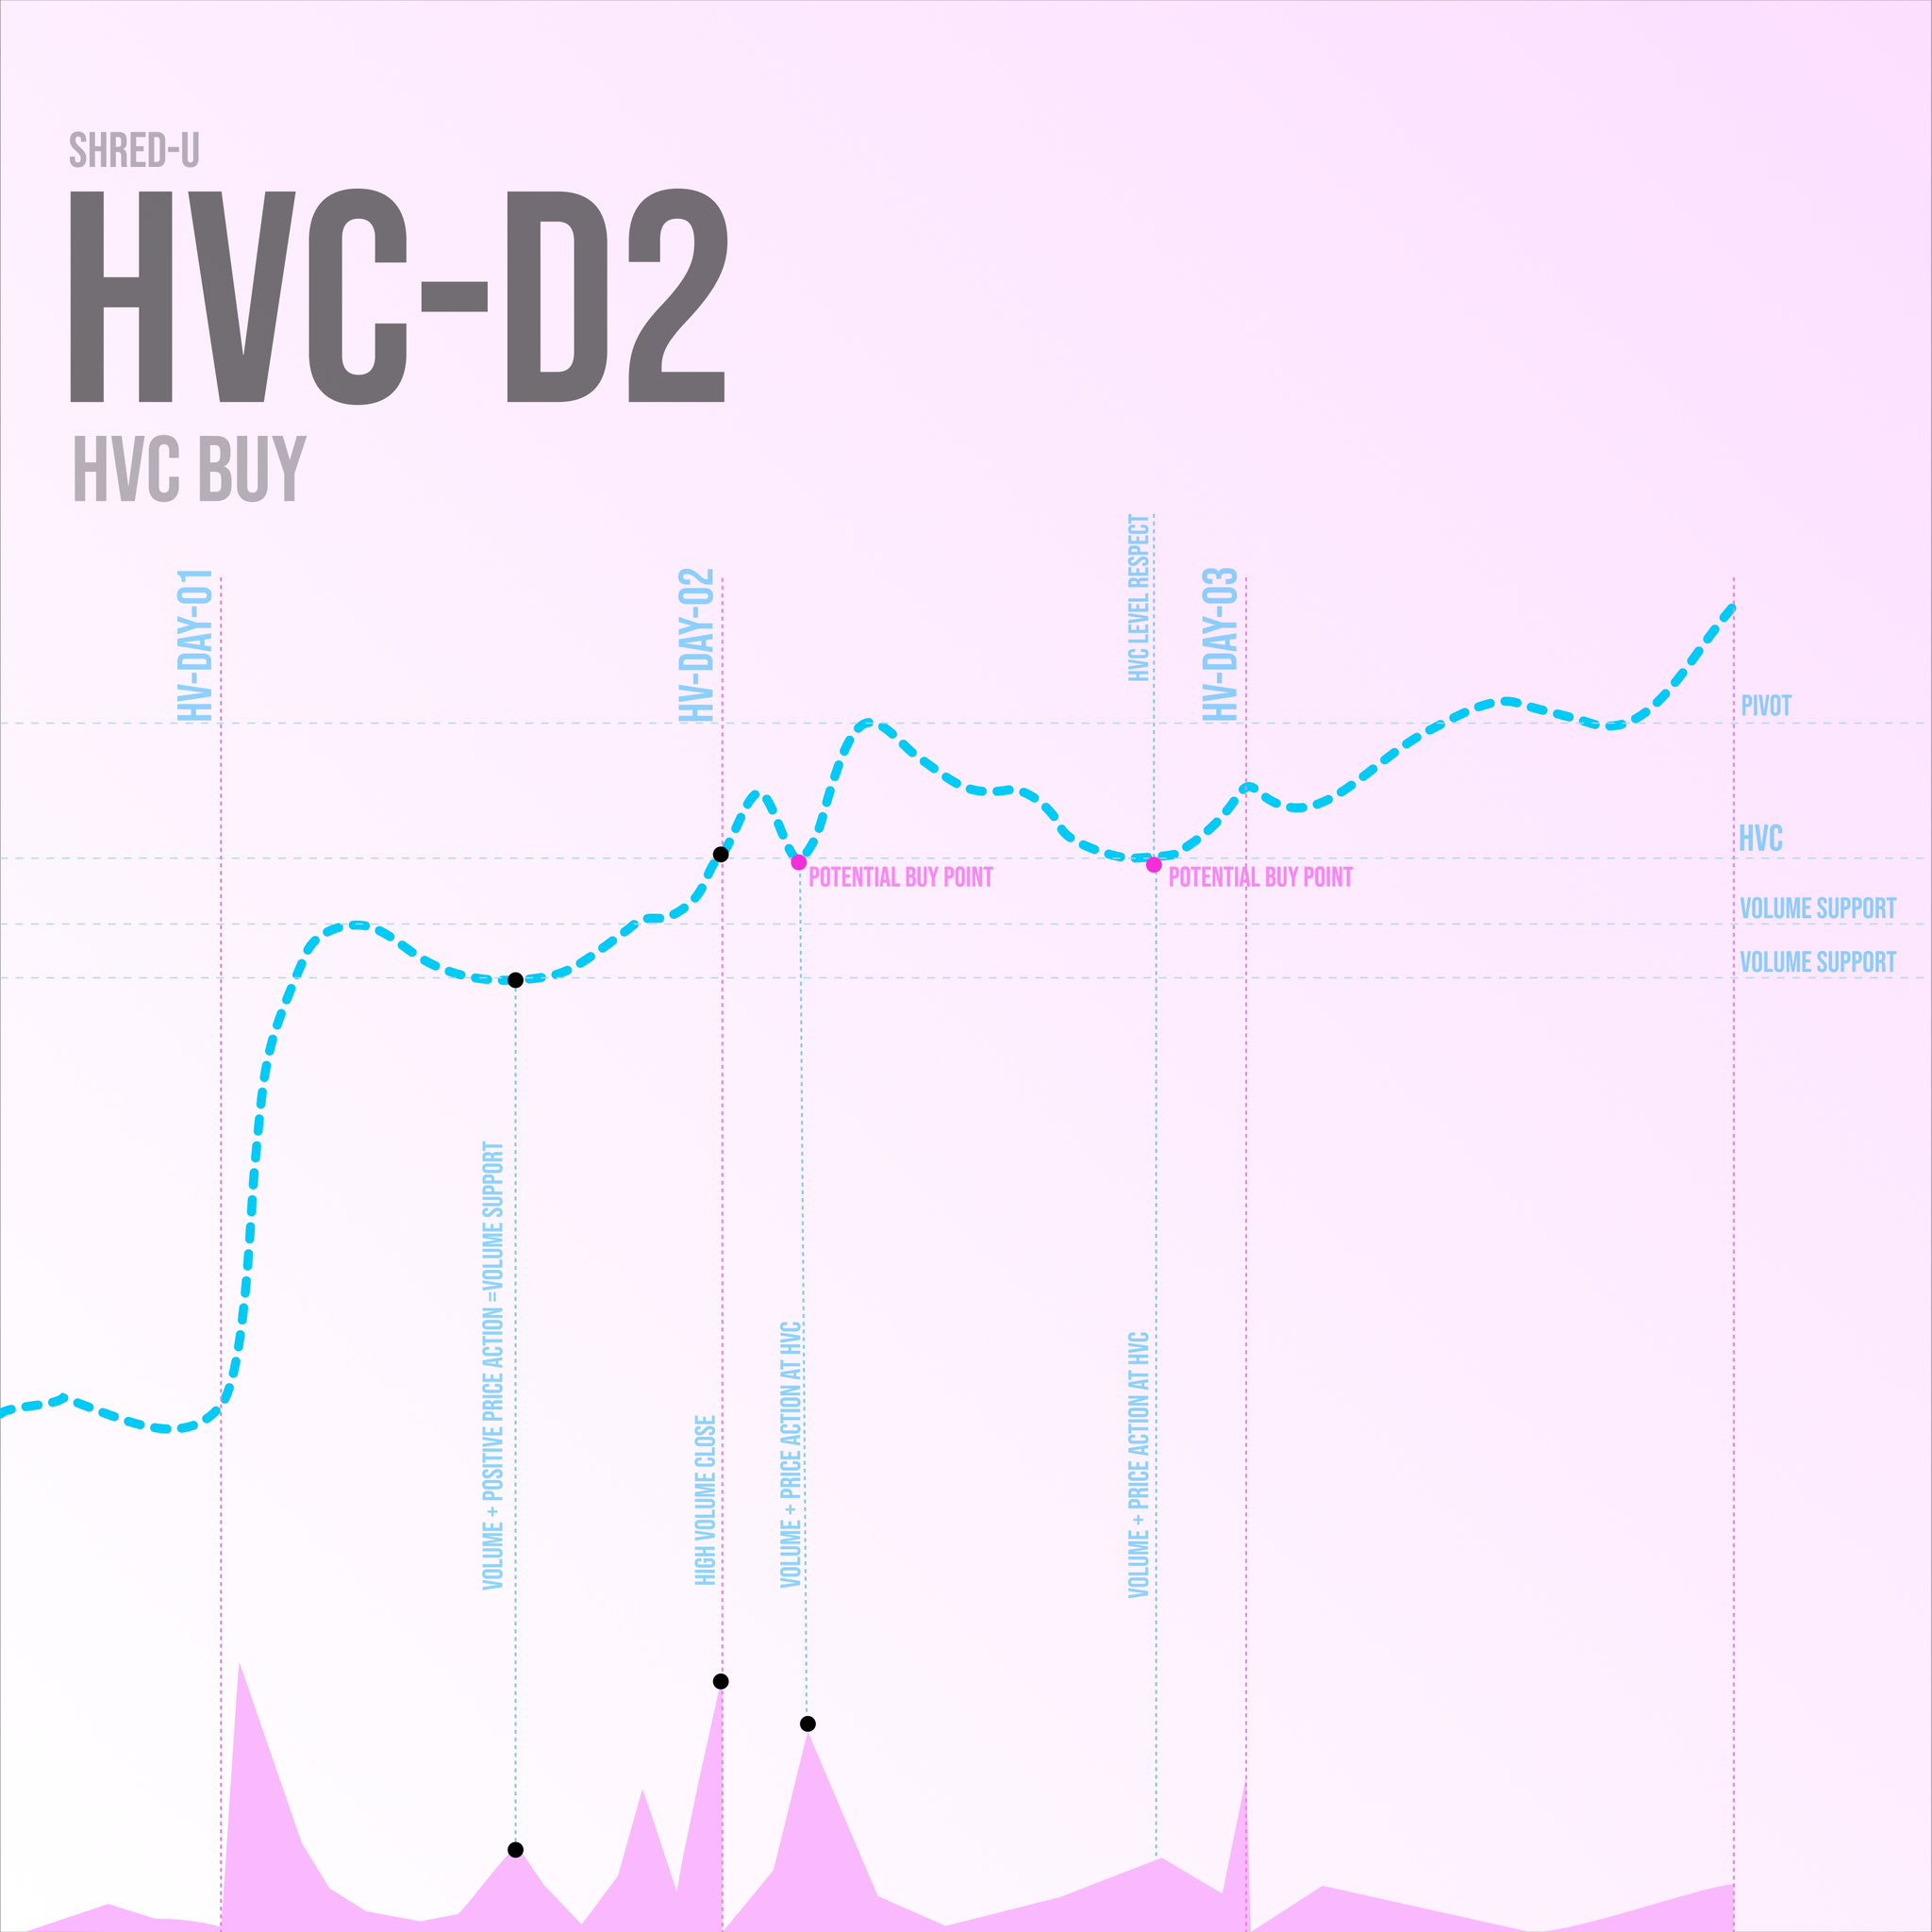
HVC-D2 - HVC BUY:
The D2 HVC buy is pretty straightforward. Here are the steps I go through:
Locate HVE, HV1 and HVIPO plays using screeners. Two times per week (sometimes more) I release my high volume screener results in the SHRED Report.
Once I’ve found one of these three, I want to make sure it’s a real catalyst behind the volume and price surge. This can be an earnings beat, upgrade, addition to an index etc.
After that, I identify the closing price of the high volume day. I usually strike a line there and then set an alert in TradingView using the 5 minute candles.
I also identify the volume support levels. These are price levels where I witness strong positive price action along with above average volume.
The next day (D2) I will watch those price levels on the 5 and 15 minute chart. If I see a strong positive price action response and sharp volume increase (a convincing bounce) at the HVC, I’m in.
I don’t like to risk more than .5% to 1% of my total capital so I will strike a balance between that amount and a good technical level to set my stop loss. ALWAYS USE A STOP LOSS :)
I highly suggest studying previous HVC winners. You will note, there will be other opportunities to enter at the HVC level most times unless you catch a real winner.
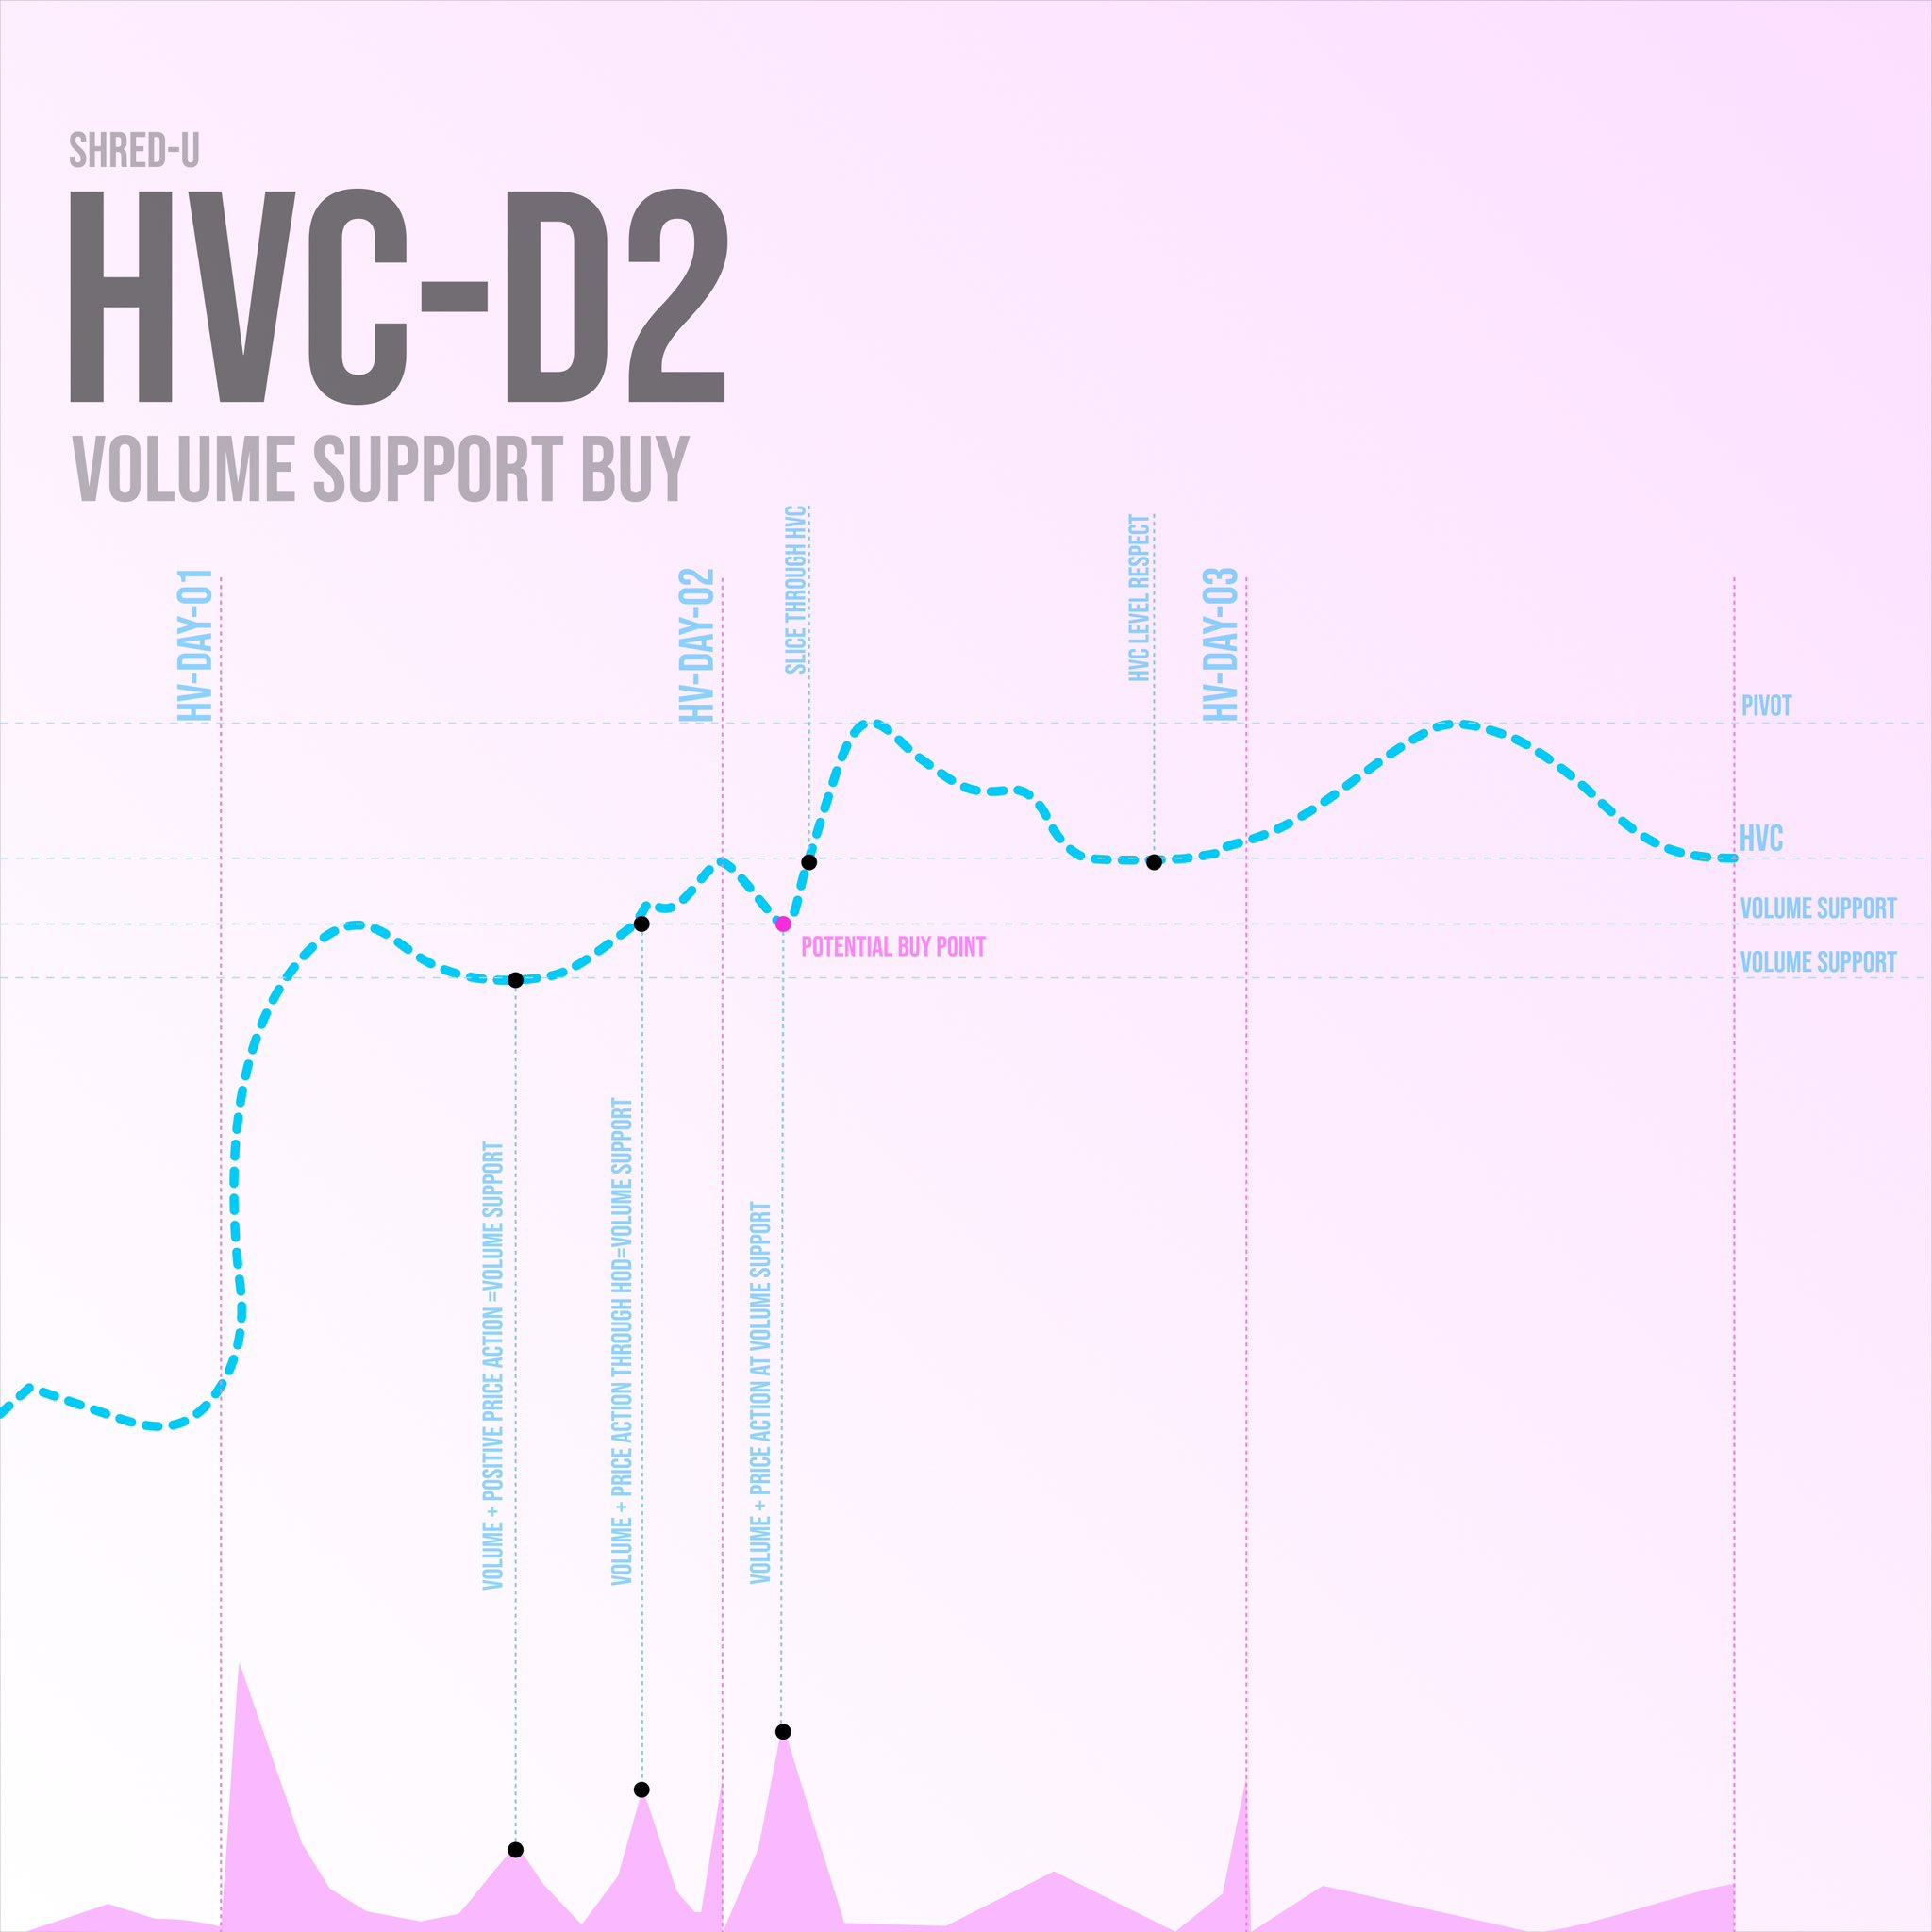
HVC-D2 - VOLUME SUPPORT BUY:
The D2 volume support buy is also pretty straightforward. Similar to above with subtle and key differences. Here are the steps I go through:
Locate HVE, HV1 and HVIPO plays using screeners. Two times per week (sometimes more) I release my high volume screener results in the SHRED Report.
Once I’ve found one of these three, I want to make sure it’s a real catalyst behind the volume and price surge. This can be an earnings beat, upgrade, addition to an index etc.
After that, I identify the closing price of the high volume day. I usually strike a line there and then set an alert in TradingView using the 5 minute candles.
I also identify the volume support levels. These are price levels where I witness strong positive price action along with above average volume.
The next day (D2) I will watch those price levels on the 5 and 15 minute chart. If I see a strong positive price action response and sharp volume increase (a convincing bounce) at the volume support levels, I’m in.
I don’t like to risk more than .5% to 1% of my total capital so I will strike a balance between that amount and a good technical level to set my stop loss. ALWAYS USE A STOP LOSS :)
I highly suggest studying previous HVC winners. You will note, there will be other opportunities to enter at the HVC level most times unless you catch a real winner.
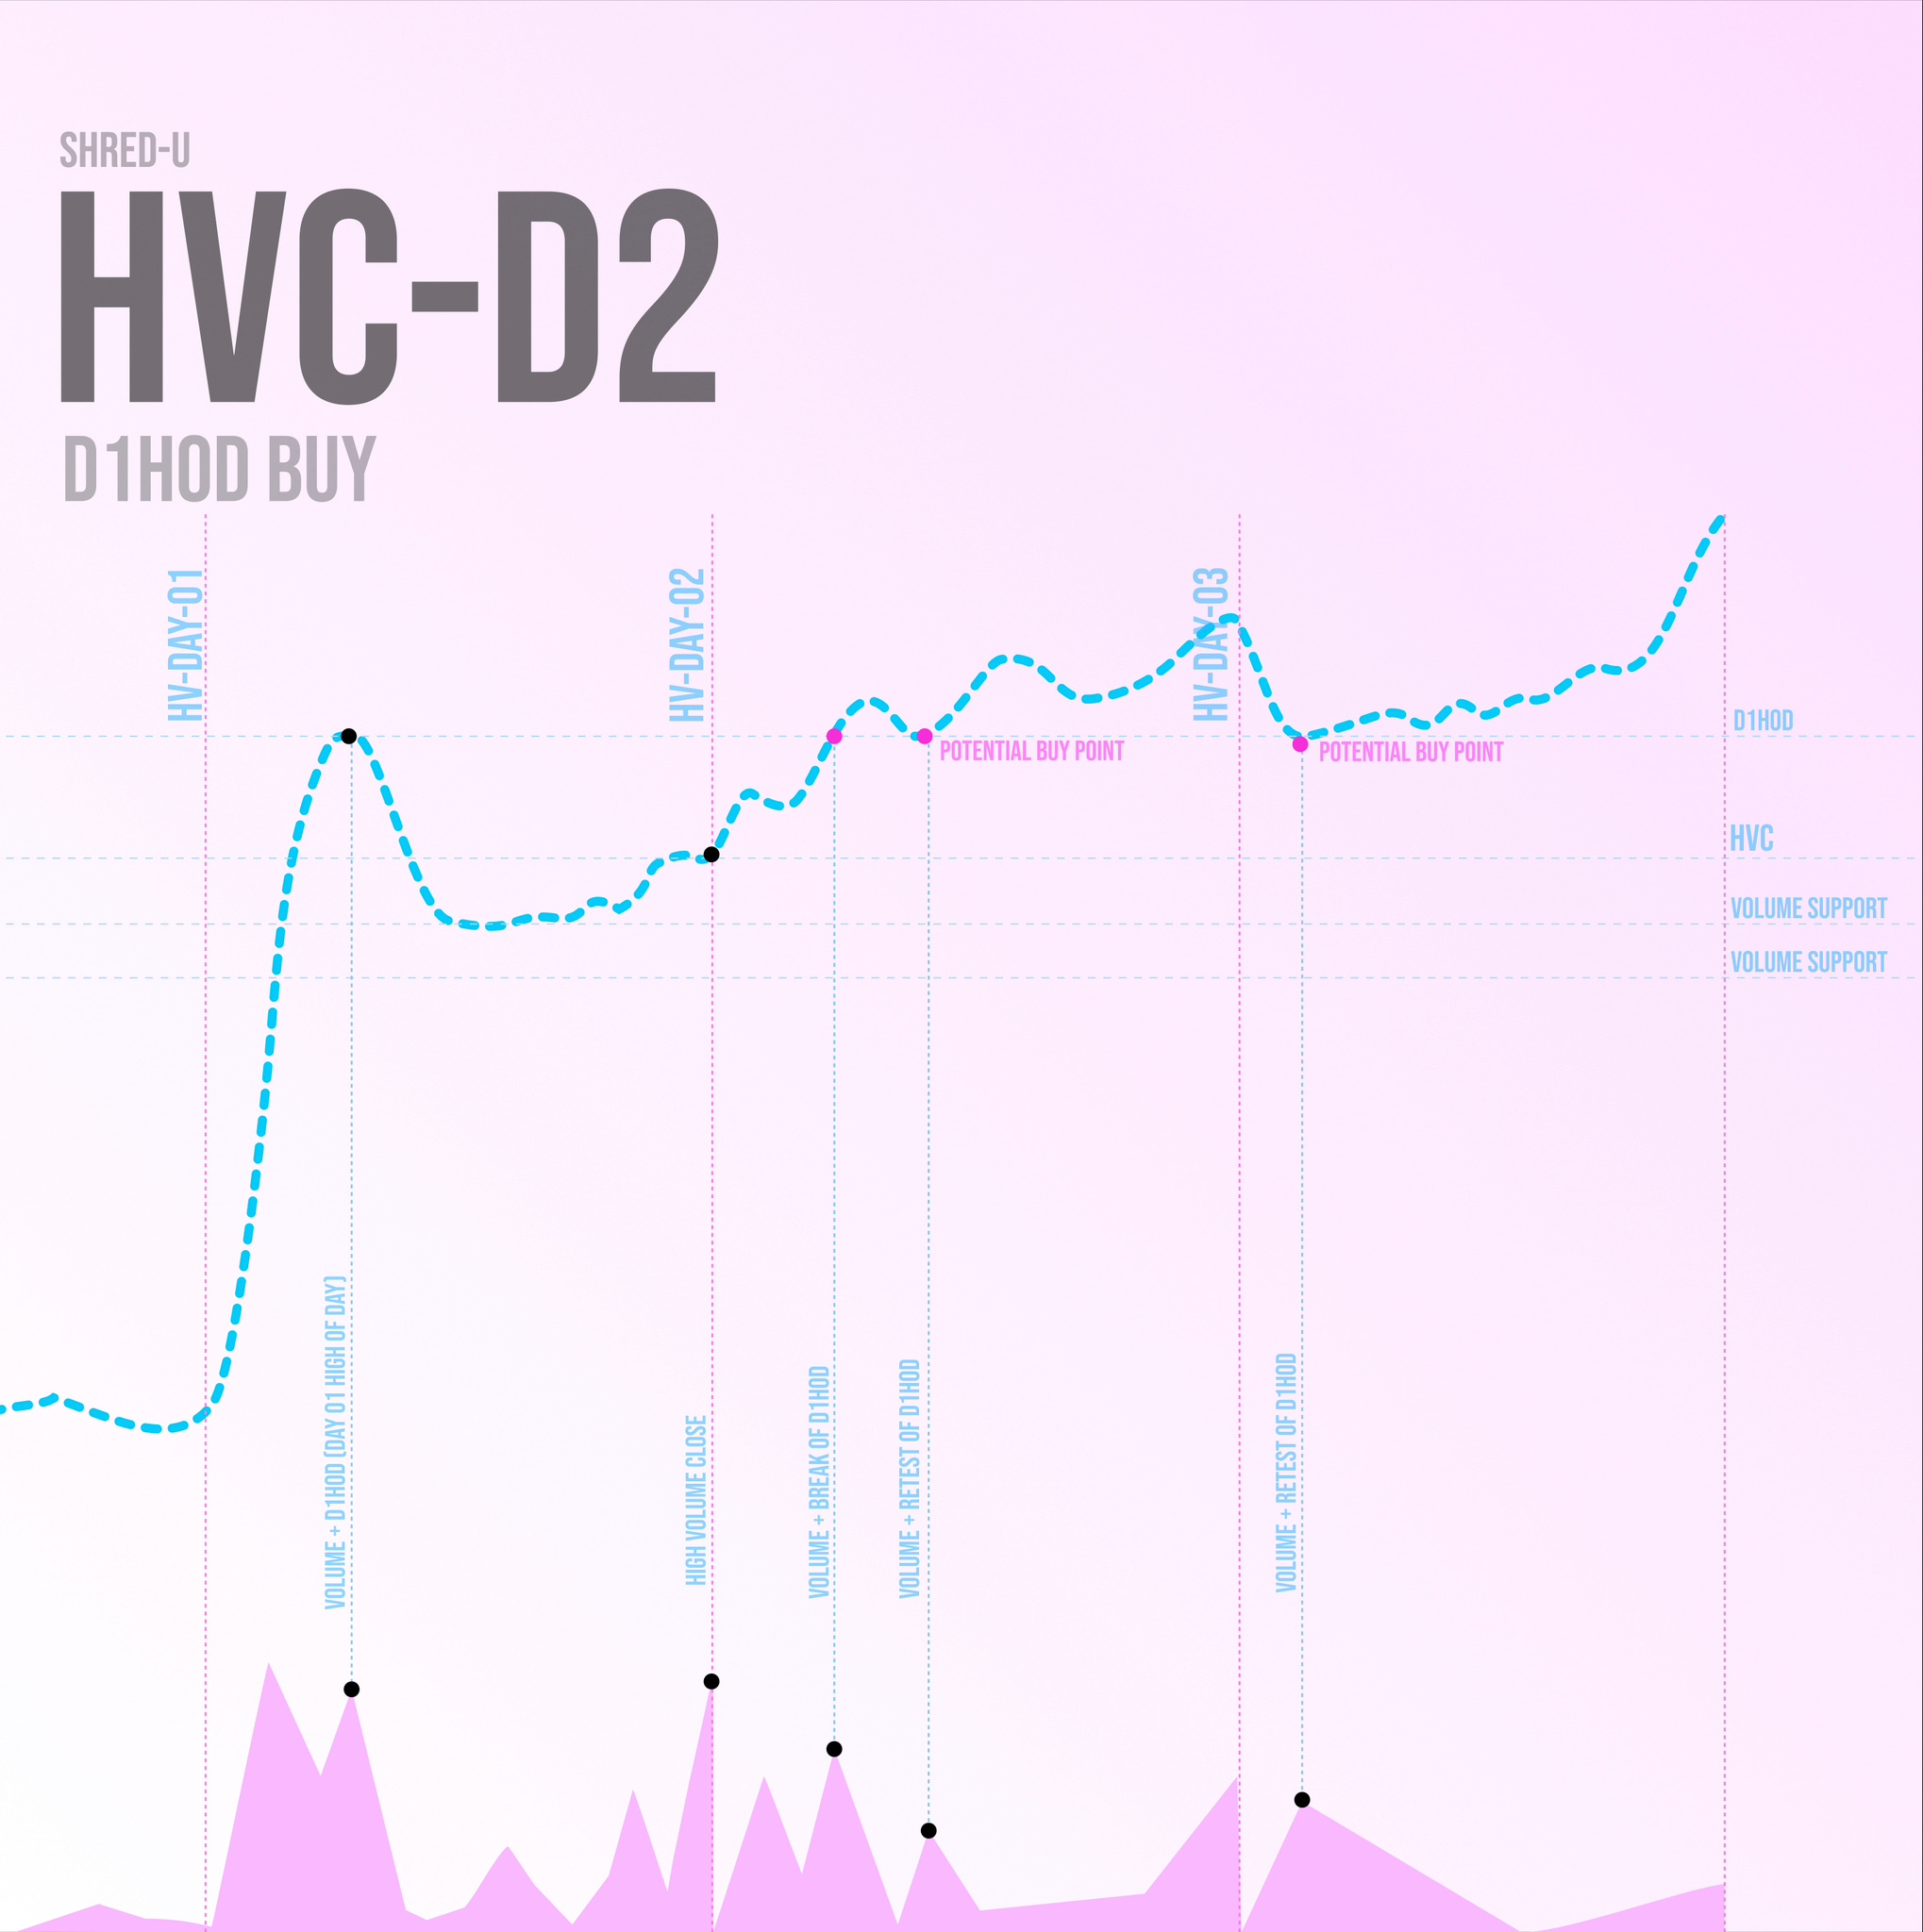
HVC-D2 - DAY 01 HIGH OF DAY BUY:
The D1HOD buy is a bit different than the previous 2 variations. Because you don’t get a lower risk entry, it forces you to be aggressive and sell into strength. I usually like to treat these as day trades. Here are the steps I go through:
Locate HVE, HV1 and HVIPO plays using screeners. Two times per week (sometimes more) I release my high volume screener results in the SHRED Report.
Once I’ve found one of these three, I want to make sure it’s a real catalyst behind the volume and price surge. This can be an earnings beat, upgrade, addition to an index etc.
After that, I identify the closing price of the high volume day. I usually strike a line there and then set an alert in TradingView using the 5 minute candles.
Here’s where the difference comes in. In addition to volume support, IF the ticker created an HOD and didn’t break it before close I’ll strike a line and set an alert there.
The next day (D2) I will watch those price levels on the 5 and 15 minute chart. If I I don’t get a buy at HVC or volume support and the ticker guns it for the D1HOD, I’ll wait for it to break that price and retest. Depending on the severity of the price action, I use the 5 and 15 min chart to confirm.
I don’t like to risk more than .5% to 1% of my total capital so I will strike a balance between that amount and a good technical level to set my stop loss. ALWAYS USE A STOP LOSS :)
I highly suggest studying previous HVC winners. You will note, there will be other opportunities to enter at the HVC level most times unless you catch a real winner.
More to come shortly!
Don’t forget to check out the educational section where I have posted my past trades using this method 👇🏻

thanks for sharing